Purpose
The purpose of this lab experiment is to study the behavior of springs in static and dynamic situations. We will determine the spring constant,
 , for an individual spring using both Hooke's Law and the properties of an oscillating spring system. It is also possible to study the effects, if any, that amplitude has on the period of a body experiencing simple harmonic motion.
 Background
If an applied force varies linearly with position, the force can be defined as
 where
where  is called the force constant. Once such physical system where this force exists is with a common helical spring acting on a body. If the spring is stretched or compressed a small distance from its equilibrium position, the spring will exert a force on the body given by Hooke's Law, namely
  | (1) |
where
 is known as the spring force. Here the constant of proportionality,
  , is the known as the spring constant, and
  is the displacement of the body from its equilibrium position (at
  = 0 ). The spring constant is an indication of the spring's stiffness. A large value for
  indicates that the spring is stiff. A low value for
  means the spring is soft. Generally speaking, springs with large
  values can balance larger forces than springs with low
  values.
 The negative sign in Equation 1 indicates that the direction of
 is always opposite the direction of the displacement. This implies that the spring force is a restoring force. In other words, the spring force always acts to restore, or return, the body to the equilibrium position regardless of the direction of the displacement, as shown in Figures 1a - 1c.
  |  | |||
Figure 1a.When the displacement is to the right ( > 0) the spring force is directed to the left ( > 0) the spring force is directed to the left ( <> <> | Figure 1b.When the displacement is to the left ( < src="http://phoenix.phys.clemson.edu/labs/124/shm/fs.gif" align="absmiddle"> > 0). < src="http://phoenix.phys.clemson.edu/labs/124/shm/fs.gif" align="absmiddle"> > 0). | |||
 | ||||
Figure 1c. In both cases shown in Figures 1a and 1b, the effect of the spring force is to return the system to the equilibrium position. At this position,  = 0 and the spring is unstretched, signifying = 0 and the spring is unstretched, signifying  = 0. = 0. | ||||
When a mass,
 , is suspended from a spring and the system is allowed to reach equilibrium, as shown in Figure 2, Newton's Second Law tells us that the magnitude of the spring force equals the weight of the body,
  . Therefore, if we know the mass of a body at equilibrium, we can determine the spring force acting on the body.
  |
Figure 2. A body of mass,  , is suspended from a spring having a spring constant, , is suspended from a spring having a spring constant,  . If the system is in equilibrium the spring force is balanced by the weight of the body. . If the system is in equilibrium the spring force is balanced by the weight of the body. |
Equation 1 applies to springs that are initially unstretched. When the body undergoes an arbitrary displacement from some initial position,
 , to some final position,
  , this equation can be written as
  | (2) |
where
 is the body's displacement. For example in Figure 3, the initial position of the body is 0.300m. When a 0.200kg mass is added to the mass pan, the spring is stretched to the 0.320m-mark as shown in Figure 4. Therefore the displacement is 0.020m. The spring force must balance the weight of the added mass (
 = 1.96N). We can then determine the spring constant for this spring:
  .
.  |  | |||
| Figure 3.The initial position of the body attached to the spring is 0.300 m as measured by the meter stick. | Figure 4.The body's mass is increased by 0.200 kg and the spring force must increase to balance the added weight. Here the spring is stretched to the 0.320-m mark and the spring constant is calculated to be 98.0 N/m (see text). |
If the body in Figure 4 is displaced from its equilibrium position some maximum distance,
 , and then released, it will oscillate about the equilibrium position. The body will move back and forth between the positions
  and
and  . When the mass travels from the maximum displacement
  to the minimum displacement
  and then back to the position
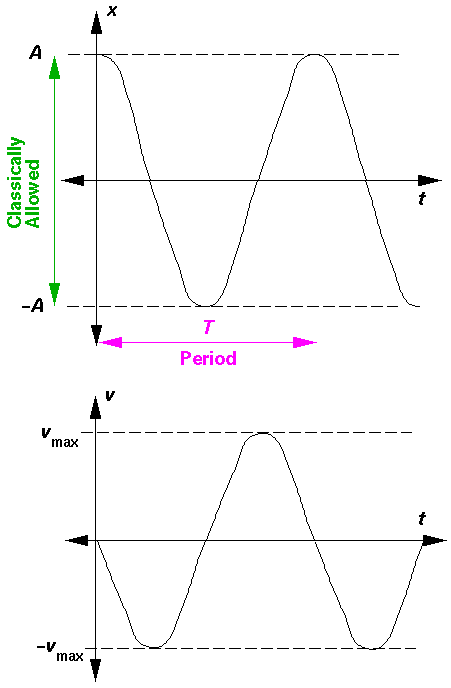
  , we say that the mass has moved through one cycle, or oscillation. When an oscillating mass (as in the case of a mass bouncing on a spring) experiences a force that is linearly proportional to its displacement but in the opposite direction, the resulting motion is known as simple harmonic motion. This motion is periodic, meaning the displacement, velocity and acceleration all vary sinusoidally. The time required for the body to complete one oscillation is defined as the period,
  , and is given by
  | (3) |
Notice the period is dependent only upon the mass of the oscillating body and the spring constant,
 . As the stiffness of the spring increases (that is, as
  increases), the period decreases which has the effect of increasing the body's average velocity. Conversely, an increase in the body's mass means the period will also increase, thereby requiring more time for the body to move through one oscillation. It should be noted that the period of motion is independent of the amplitude of the oscillations.
 Objectives
- Use the apparatus and what you know about Hooke's Law to determine the spring constant,
 , of your spring. Remember, do not suspend more than 1000! from your spring!
 - Use the apparatus and what you know about oscillating spring-mass systems to determine the spring constant,
 , of your spring. Remember, do not suspend more than 1000! from your spring!
 - xxx
Derivation of SHM formulae from uniform circular motion
 |
 |
Vertical Spring and Hanging Mass
Our prototype for SHM has been a horizontal spring attached to a mass,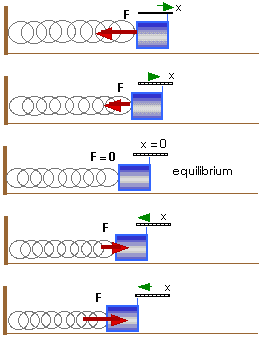
Consider a vertical spring on which we hang a mass m; it will stretch a distance
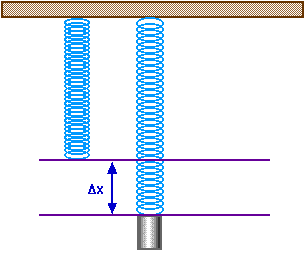
Now pull the mass down an additional distance x',
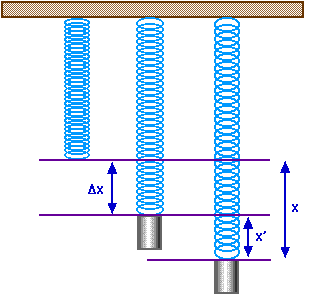
Fspring = - k x' - k
Fspring = - k x' - mg
Fnet = - k x'
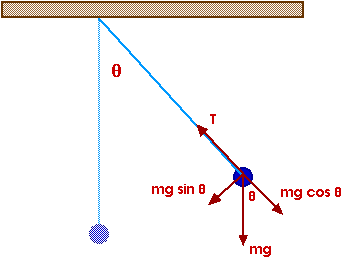
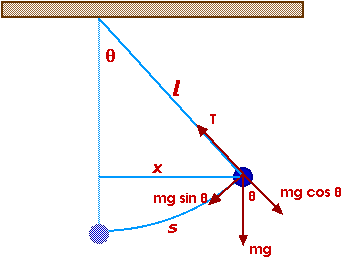
Simple Pendulum
where s is the displacement from equilibrium.The net restoring force is 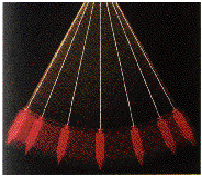
Fnet = - m g sin And this is not exactly what we had for our prototype,- m g sin
= m a
a = - g sin
Fnet = - k x = ma a = - ( k / m ) x Or is it?
Look more closely at this sin:
sin And for small angles, this is nearly equal to= opp / hyp
sin= opp / hyp
sin= x / l
sin Now we have= s / l
a = - g sin or
a = - g (s / l) or
a = - ( g / l ) s
So this simple pendulum is a SHO for small angular displacements!
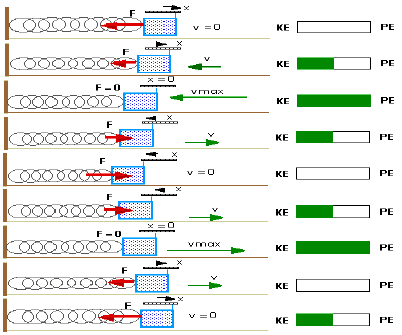
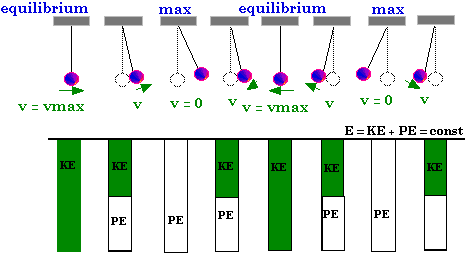
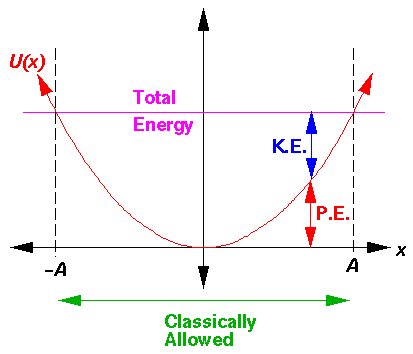
Energy
of a Simple Harmonic Oscillator
Damped and Driven Harmonic Motion
Real oscillators do not continue to move forever. They gradually decrease their motion.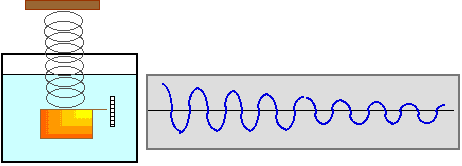

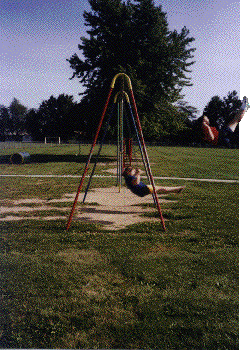 | If you give only little pushes to an oscillator -- but ensure that those pushes come at just the right time -- you can still give the oscillator a very large amplitude. A fine example of this is pushing someone on a playground swing. If you give just a small push, but give it at the right time, your friend can still end up swinging very high. This is an example of resonance of a driven harmonic oscillator. |
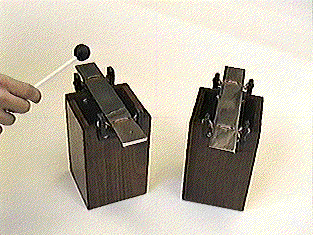
Another example of resonance are these carefully matched chime boxes. The the motion of the air caused by the sound from one will cause the other one to vibrate.
|  |
Equipment and setup
| [Click on images to enlarge.]
|
Hints and Cautions
- Caution!!! Only use masses 1000 grams and less! Doing so will over-stretch the springs, which will permanently deform them and render them useless.
Online Assistance
- Stopwatch timer
- Adding a trendline to an Excel plot
- Adding a non-linear trendline to an Excel plot
- Create plots of two data series on one graph
- Fitting multiple curves (trendlines) to one data set
- Clemson Physics Lab Tutorials
- Measurement uncertainties
- Using Excel
- Graphing data using Excel
- Using error bars in Excel
Nudge Questions
These Nudge Questions are to be answered by your group and checked by your TA as you do the lab. They should be answered in your lab notebook.
Objective 1 Nudges
- Which set of masses will you use for this experiment, the hooked masses or the slotted ones? Why?
- How will you determine the position,
 , of the hanging mass?
 - What is the uncertainty in the position measurements?
- In order to conduct the experiment properly, must you consider the position or the change in the position; or both?
- How many data points will you take for this experiment?
- What mass values will you use for this experiment? Remember, do not suspend more than 1000g from your spring!
- What is the uncertainty in the mass measurements?
- How will you measure the spring force,
 ?
? - What quantities will you plot in order to determine,
 ?
? - What value did you find for
 ?
? - What are your units of
 ?
? - From your data and graph, what is the minimum mass,
 , necessary to stretch the spring?
 - Does the best-fit line of your graph fall within the data points' error bars?
- What is the uncertainty in your value for
 ?
?
- Which set of masses will you use for this experiment, the hooked masses or the slotted ones? Why?
- What oscillation amplitude will you use for this experiment? How is this determined?
- Does the value of the oscillation amplitude affect your results? (See Objective 2.)
- How will you determine the period,
 , of the oscillating spring-mass system?
 - How will you decrease the uncertainty in the period measurement?
- What is the uncertainty in the period measurements?
- How many data points will you take for this experiment?
- What mass values will you use for this experiment? Remember, do not suspend more than 1000g from your spring!
- What is the uncertainty in the mass measurements?
- What quantities will you plot in order to determine,
 ?
? - What value did you find for
 ?
? - What are your units of
 ?
? - Does the best-fit line of your graph fall within the data points' error bars?
- What is the uncertainty in your value for
 ?
? - How does the value for
 , found from Objective 1, compare to this value?
 - Which value is more accurate and why?
- xxx
 ,
,
Questions
These Questions are also found in the lab write-up template. They must be answered by each individual of the group. This is not a team activity. Each person should attach their own copy to the lab report just prior to handing in the lab to your TA.
- From your data and graph in Objective 1, what is the minimum mass,
 , necessary to stretch the spring?
 - Does Hooke's Law apply to an oscillating spring-mass system? If so, what equipment would you need and what parameters would you record in order to take data for a Hooke's Law experiment when the spring-mass system is oscillating?
- When a box of unknown mass is placed into the trunk of a car, both rear shocks are compressed a distance of 7.0cm. If we assume the two rear shocks are made from springs, each with a spring constant value of
 = 35,000N/m, what is the mass of the box? (Assume g = 9.80m/s2).
 - Mass is added to a vertically hanging rubber band and the displacement is measured with the addition of each mass. The recorded data is displayed in the table below. Based on this data, does a rubber band obey Hooke's Law? Explain why or why not?
Rubber Band Experiment Mass Added
(kg)Displacement, x
(m)0.100 0.10 0.200 0.20 0.300 0.35 0.400 0.55 0.500 0.80 - A toy maker requires a spring mechanism to drive an attached component with a period of 0.50s. If the mass of the component is 10g, what must the value of the spring constant,
 , be?
, be?
